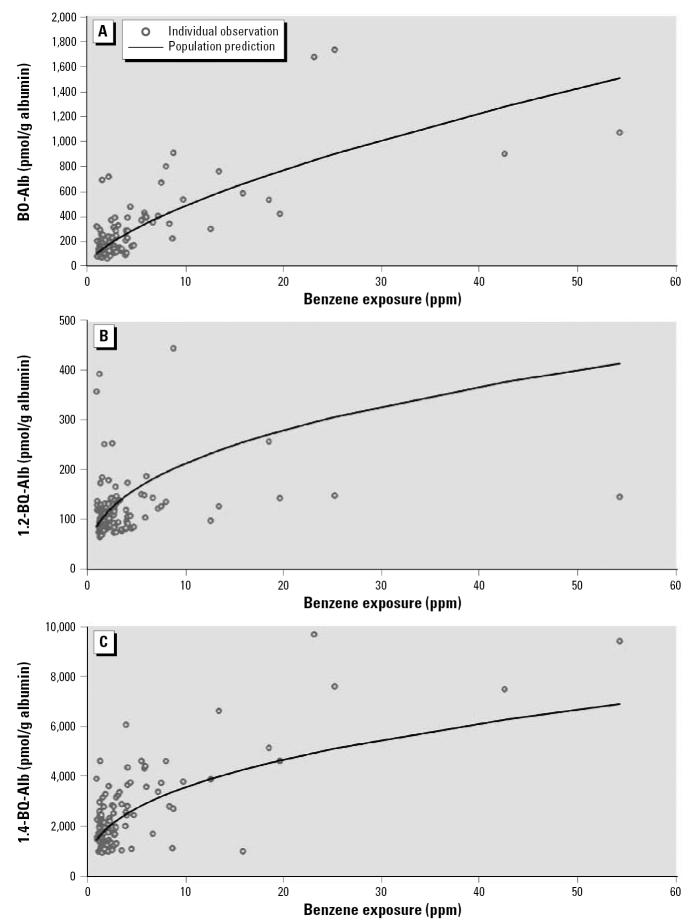
Figure 3.
Predicted natural-scale relationships between levels of BO-Alb (A), 1,2-BQ-Alb (B), and 1,4-BQ-Alb (C). Data points represent adduct levels derived from serum from nonsmoking subjects of average weight and BMI, with benzene exposure of ≥ 1 ppm; curves show adduct levels predicted from multivariate linear models shown in Tables 3–5.

