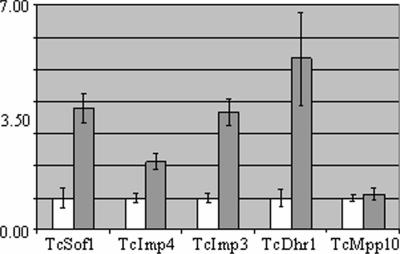
FIG. 4.
Quantitative PCR analysis of SSU processome complex genes. Polysomal RNA fractions of epimastigotes (white bars) and metacyclic trypomastigotes (gray bars) were analyzed. Standard deviations for triplicate experiments are shown. Results were normalized against those for the L9 ribosomal protein.

