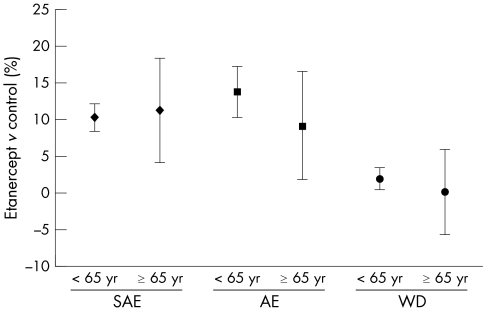
Figure 1 AE and subject withdrawals owing to AE are not significantly higher in elderly subjects. Data points represent the difference in the proportion of subjects in treatment and control groups (percentage of subjects in etanercept treatment group – percentage of subjects in control groups) reporting AE, SAE, and subject withdrawals owing to AE (WD). Error bars represent 95% CIs.

An official website of the United States government
Here's how you know
Official websites use .gov
A
.gov website belongs to an official
government organization in the United States.
Secure .gov websites use HTTPS
A lock (
) or https:// means you've safely
connected to the .gov website. Share sensitive
information only on official, secure websites.
