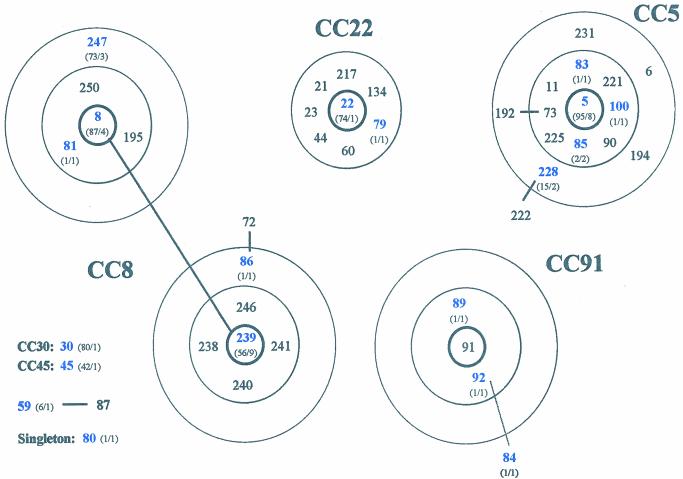
FIG. 1.
Diagram of CCs defined with the algorithm BURST. Each number represents an MLST-derived ST. The ST of the predicted ancestral genotype is placed in the central circle, SLVs are within the second circle, and DLVs within the outer dotted circle. One ST (ST59) for which an ancestral genotype cannot be inferred and one ST (ST80) that is not member of any CC (singletons) are also shown. CC30 and CC45 are not graphically represented since they are represented by unique STs in the present study. Blue numbers denote STs found in the present study; black numbers denote STs in the database associated with a particular CC. The numbers of isolates with a particular ST deposited in the database, followed by the numbers of isolates with that ST found in our study, e.g., “(73/3),” are given in parentheses.

