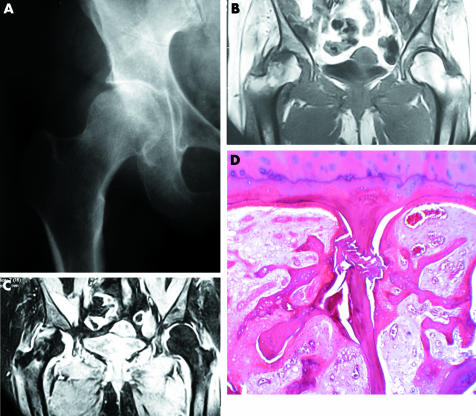
Figure 1 (A) Radiograph obtained 1 month after the first visit shows progressive joint space narrowing with associated flattening of the lateral portion of the femoral head. (B, C) MRI shows a bone marrow oedema pattern, mainly at the lateral part of the femoral head extending to the intertrochanteric area. On T1 weighted image (repetition time (TR)/echo time (TE) = 380/20 ms), in addition to the diffuse low intensity, an irregular serpiginous low intensity band is present at the superolateral margin of the femoral head (B). On T2 weighted image (TR/TE = 1246/16 ms), both the band and the area between the band and the articular surface show high signal intensity. (D) Microscopically the whitish regions consist of fractured original lamellar bone with associated fracture callus, reactive cartilage, and granulation tissue. There is no evidence of antecedent osteonecrosis. (Haematoxylin and eosin; original magnification ×40.)

An official website of the United States government
Here's how you know
Official websites use .gov
A
.gov website belongs to an official
government organization in the United States.
Secure .gov websites use HTTPS
A lock (
) or https:// means you've safely
connected to the .gov website. Share sensitive
information only on official, secure websites.
