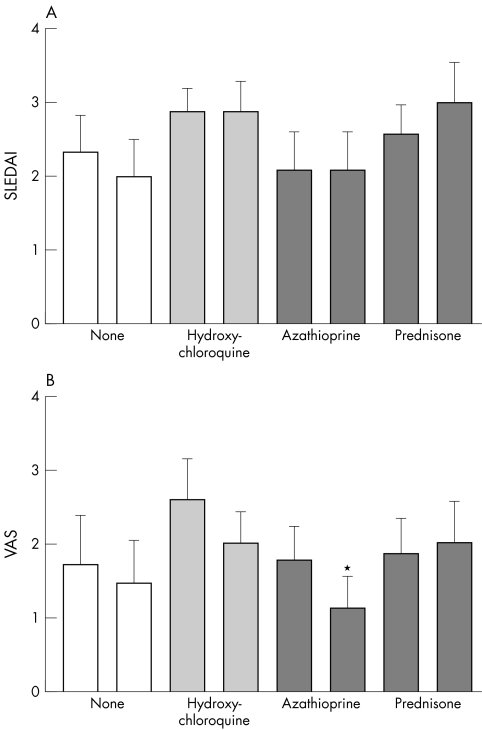
Figure 1 Influence of vaccination on disease activity in the different patient groups. Disease activity was measured by the SLE disease activity index (SLEDAI) (A) and patient visual analogue score (VAS) (B), depicting patients' perception of disease activity. Columns are means, error bars = SEM. The left bars in each pair represent results before, the right bars 30 days after vaccination. *p<0.05 (Wilcoxon signed rank test).

An official website of the United States government
Here's how you know
Official websites use .gov
A
.gov website belongs to an official
government organization in the United States.
Secure .gov websites use HTTPS
A lock (
) or https:// means you've safely
connected to the .gov website. Share sensitive
information only on official, secure websites.
