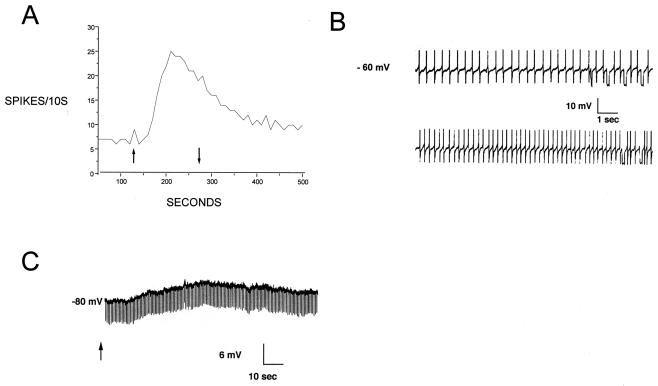
Figure 2.
Orexin A excitation in the locus coeruleus. (A) Extracellular recording of a single unit. Vertical axis is the number of suprathreshold spikes per 10-s period. Orexin A (1 μM) was applied between the arrows. (B) Intracellular recording of identified locus coeruleus neurone. (Upper) Baseline firing at the resting potential in normal artificial cerebrospinal fluid. (Lower) Increased action potential frequency at the peak of the response to 1 μM orexin A. (C) Intracellular recording of a locus coeruleus cell hyperpolarized to −80 mV by steady current injection. In the absence of action potentials, a clear depolarization is observed as a response to 1 μM orexin A (applied at arrow). Downward deflections in the trace are responses to 200-ms current pulses to monitor cell resistance. Note the absence of a clear change of resistance at the peak of the orexin A response.

