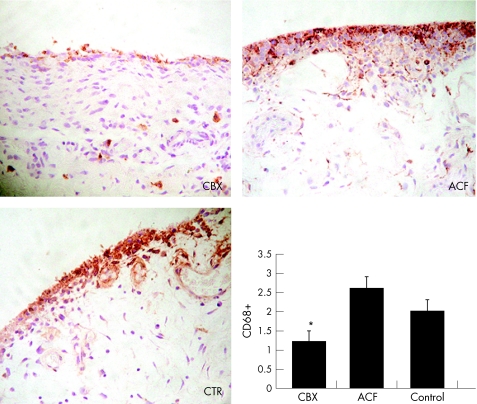
Figure 2 Localisation of CD68 positive cells in the SM sections from CBX, ACF, and control patients. Photographs are representative of seven to nine patients from each group (peroxidase technique; original magnification ×200). The bar graph shows the semiquantitative scoring according to the description given in the “Patients and methods” section. *p<0.05 v ACF patients. Data represent the mean (SEM), n = 7–9 per group.

An official website of the United States government
Here's how you know
Official websites use .gov
A
.gov website belongs to an official
government organization in the United States.
Secure .gov websites use HTTPS
A lock (
) or https:// means you've safely
connected to the .gov website. Share sensitive
information only on official, secure websites.
