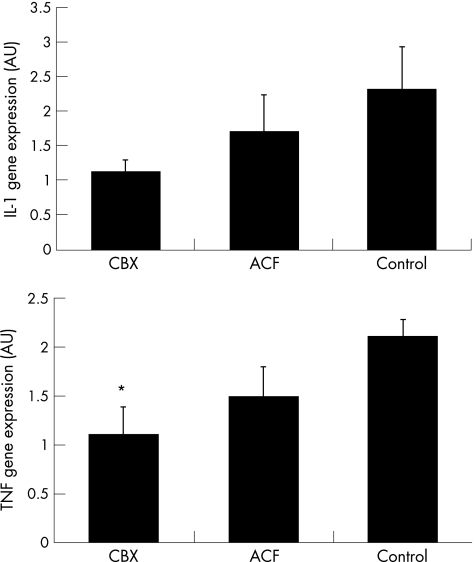
Figure 4 Gene expression of IL1β and TNFα at the SM in CBX, ACF, and control groups of patients measured by real time PCR. The comparative Ct method was used for relative quantification. IL1 and TNFα mRNA expression were normalised relative to 18S rRNA in each well, and each patient value for each gene expression was then normalised relative to the calibrator value (one of the CBX patients was chosen as calibrator = 1). All real time PCR samples were processed in triplicate. *p<0.05 v control patients. Data represent the mean (SEM), n = 7–9 per group.

An official website of the United States government
Here's how you know
Official websites use .gov
A
.gov website belongs to an official
government organization in the United States.
Secure .gov websites use HTTPS
A lock (
) or https:// means you've safely
connected to the .gov website. Share sensitive
information only on official, secure websites.
