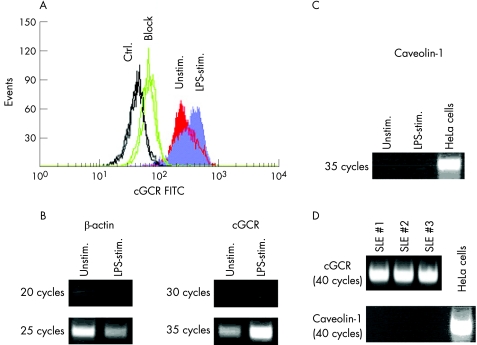
Figure 5 Correlation of caveolin‐1 expression and cytosolic glucocorticoid receptor (cGCR) expression in freshly isolated CD14+ human primary monocytes. (A) Immunofluorescence analysis of cGCR protein in lipopolysaccharide (LPS)‐stimulated (stim.) and unstimulated (Unstim.) monocytes (CD14+). Control (Ctrl.) was without a GCR antibody, and “block” refers to a parallel incubation with unlabelled anti‐GCR antibody in excess. (B) Semiquantitative polymerase chain reaction (PCR) analysis of cGCR transcript in normal monocytes (unstimulated and LPS stimulated). (C) Semiquantitative PCR analysis of caveolin‐1 transcript in normal monocytes (unstimulated and LPS stimulated). cDNA of HeLa cells was used as a positive control. (D) Semiquantitative PCR analysis of cGCR and caveolin‐1 transcript in monocytes from patients with systemic lupus erythematosus. FITC, fluorescein isothiocyanate.

An official website of the United States government
Here's how you know
Official websites use .gov
A
.gov website belongs to an official
government organization in the United States.
Secure .gov websites use HTTPS
A lock (
) or https:// means you've safely
connected to the .gov website. Share sensitive
information only on official, secure websites.
