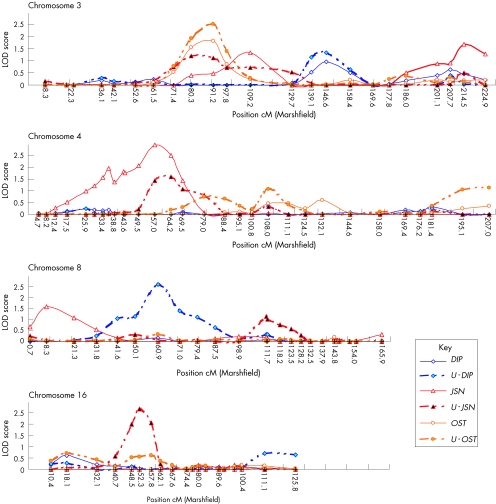
Figure 1 Multipoint quantitative analysis for chromosomes 3, 4, 8 and 16. The x axis shows the relative position on each chromosome (cM) and the y axis shows the logarithm of the odds linkage (LOD). DIP, distal interphalangeal; JSN, joint‐space narrowing; OST, osteophyte; U‐DIP, unaffected and distal interphalangeal; U‐JSN, unaffected and joint‐space narrowing; U‐OST, unaffected and osteophyte.

An official website of the United States government
Here's how you know
Official websites use .gov
A
.gov website belongs to an official
government organization in the United States.
Secure .gov websites use HTTPS
A lock (
) or https:// means you've safely
connected to the .gov website. Share sensitive
information only on official, secure websites.
