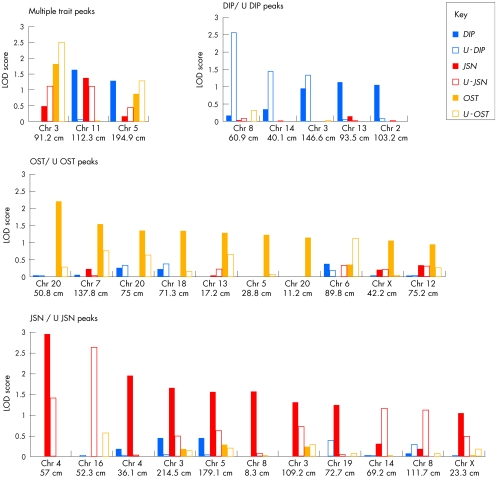
Figure 2 Loci identified from the quantitative multipoint linkage analysis. The loci are grouped according to whether they were identified by more than one of the three traits (multiple‐trait loci) and those identified by a single trait (ie, by analysis using either of the two quantitative indices for each trait). In each of the groups, the chromosome and map position (cM; Marshfield) corresponding to the maximum logarithm of the odds of linkage (LOD) score for each locus is given on the x axis. The bars represent the results for each quantitative index at each locus coded as per the key and as described in the text. The y axis shows the multipoint LOD score. Chr, chromosome; DIP, distal interphalangeal; JSN, joint‐space narrowing; OST, osteophyte; U‐DIP, unaffected distal interphalangeal; U‐JSN, unaffected joint‐space narrowing; U‐OST, unaffected osteophyte.

An official website of the United States government
Here's how you know
Official websites use .gov
A
.gov website belongs to an official
government organization in the United States.
Secure .gov websites use HTTPS
A lock (
) or https:// means you've safely
connected to the .gov website. Share sensitive
information only on official, secure websites.
