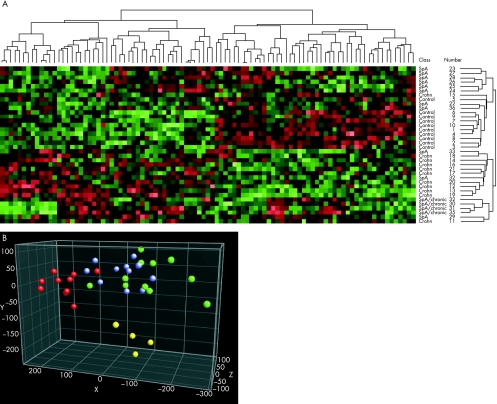
Figure 2 (A) Complete linkage clustering based on a set of 95 genes whose expression is deviant in patients with Crohn's disease (Crohn) and in those with spondyloarthropathy (SpA) and chronic gut inflammation as compared with healthy controls. Two main clusters mark an SpA–control cluster and a Crohn's disease–SpA with chronic inflammation cluster. (B) Principal component analysis view with a set of 95 genes whose expression is deviant in patients with Crohn's disease and in those with SpA and chronic gut inflammation. Crohn's disease (green circles), SpA without chronic inflammation (blue circles), SpA with chronic inflammation (yellow circles) and controls (red circles).

An official website of the United States government
Here's how you know
Official websites use .gov
A
.gov website belongs to an official
government organization in the United States.
Secure .gov websites use HTTPS
A lock (
) or https:// means you've safely
connected to the .gov website. Share sensitive
information only on official, secure websites.
