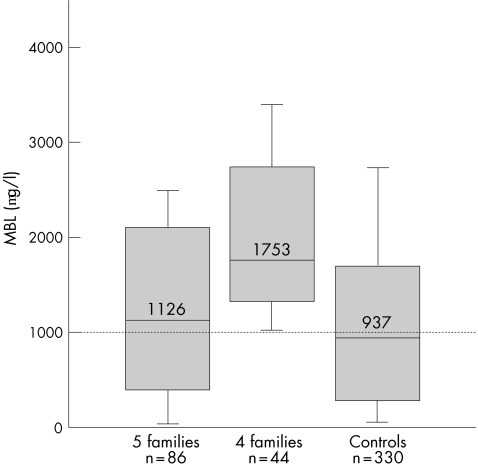
Figure 2 Serum levels of mannan‐binding lectin (MBL) in the families stratified into five families with and four families without low MBL genotypes compared with 330 adult Icelander controls. Whereas members of the five families with low MBL have MBL levels overall similar to that of the controls (p = 0.2), members of the four families without low MBL genotypes have significantly higher MBL levels (p<0.001) and the distribution is, as expected, similar to that for the high MBL genotype (fig 1). Box plots show the median values and interquartiles, and the bars show the 10th centiles of MBL concentrations.

An official website of the United States government
Here's how you know
Official websites use .gov
A
.gov website belongs to an official
government organization in the United States.
Secure .gov websites use HTTPS
A lock (
) or https:// means you've safely
connected to the .gov website. Share sensitive
information only on official, secure websites.
