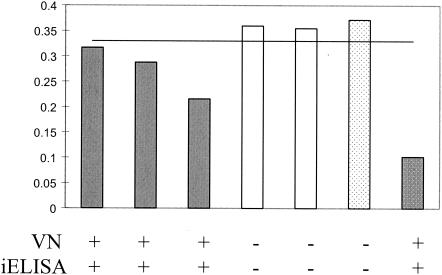
FIG. 4.
Antibody titers in experimentally infected ducks. The graph shows the ODs from the bELISA. Values below 0.34 represent positivity for antibodies to aMPV. Gray bars, vaccinated turkeys; white bars, control turkeys; dotted bars, positive (gray) and negative (white) controls. The results of the VN assay and the iELISA are presented below the graph. Serum samples were taken at 14 days postinoculation.

