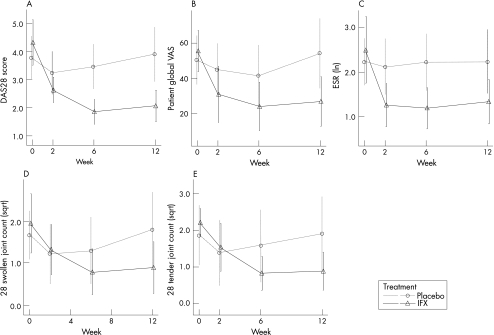
Figure 1 Plots of the Disease Activity Score for the 28‐joint count (DAS28) score and different single measures. (A) Evolution of the DAS28 over time. (B–E) Evolution of the components of the DAS28 over time. (F,G) Evolution of 66 and 68 swollen and tender joint counts over time. There is more overlap of the error bars of the individual components and the 66 and 68 swollen joint counts than the DAS28. ESR, erythrocyte sedimentation rate at first hour; ln, natural logarithm; sqrt, squared root. Error bars show mean (2 SE).

An official website of the United States government
Here's how you know
Official websites use .gov
A
.gov website belongs to an official
government organization in the United States.
Secure .gov websites use HTTPS
A lock (
) or https:// means you've safely
connected to the .gov website. Share sensitive
information only on official, secure websites.
