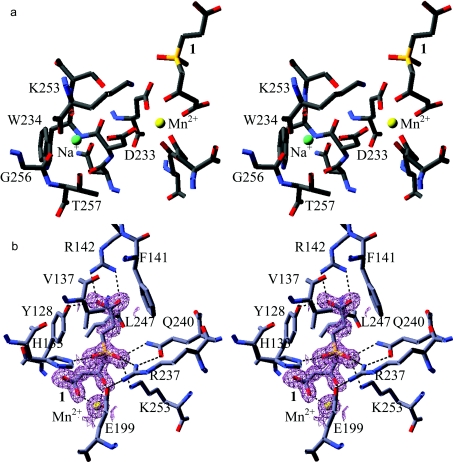
Figure 3. Stereo diagrams of metal-binding sites (a) and active site (b) in FAH.
(a) Stereo diagram of the metal-binding sites in FAH. The catalytic Mn2+ ion to which the FAH inhibitor 1 is bound is coloured yellow and the structural sodium ion is coloured green. (b) Stereo diagram of the active site in FAH. A stereo diagram of the active site is shown with Mn2+ coloured yellow and C, N and O coloured grey, blue and red respectively. A 2Fo–Fc electron density map for the FAH inhibitor 1 and Mn2+ is contoured in purple at a level of 2σ. Broken lines indicate important hydrogen bonds that stabilize the complex.

