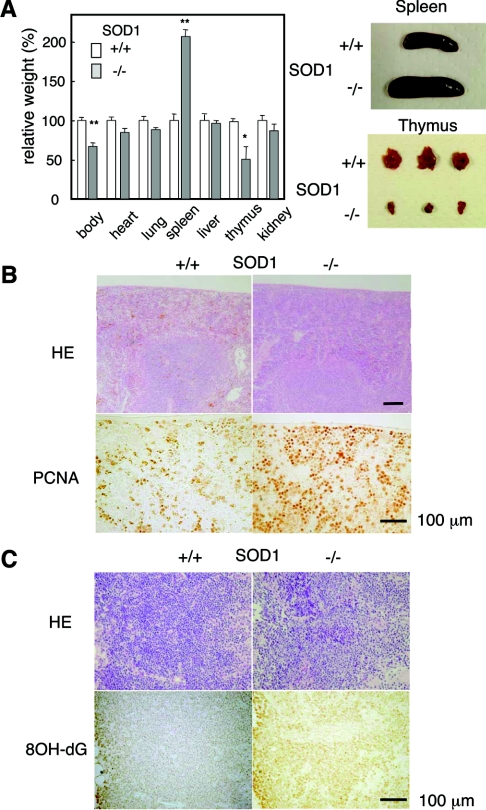
Figure 2. Comparison of organs between SOD1+/+ and SOD1−/− mice.
(A) Relative weight ratios (%) of each organ in SOD1−/− mice to values for SOD1+/+ mice at 40 weeks of age are shown. n=7 for SOD+/+ and n=8 for SOD−/−. Examples of dissected spleen and thymus are shown on the right. (B) HE staining and immunohistochemial detection of PCNA (proliferating-cell nuclear antigen) in the spleen at 24 weeks of age. (C) Sections of the thymus stained with HE and immunostained using an anti-8-hydroxyguanine (8OH-dG) antibody.

