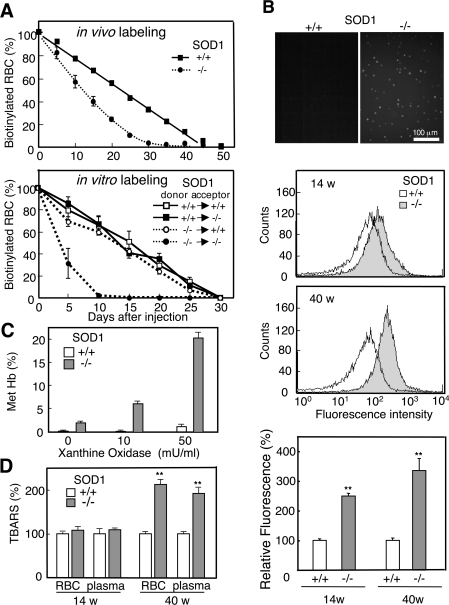
Figure 3. Elevated oxidative stress and increased vulnerability in SOD1-deficient erythrocytes.
(A) NHS-LC-biotin was intravenously injected into 12-week-old mice at day 0 (upper panel). Blood, collected from SOD1+/+ and SOD1−/− mice, was biotinylated in vitro and returned to either SOD1+/+ or SOD1−/− mice (lower panel). At the indicated time points, an aliquot of blood was reacted with phycoerythrin-conjugated streptavidin followed by FACS analysis to determine the fraction of labelled RBCs remaining. n=3 for SOD1+/+ and n=6 for SOD1−/−. (B) Blood collected from SOD1+/+ or SOD1−/− was incubated with DHR123 and observed under a fluorescent microscope (top panel). ROS levels of RBCs at 14- and 40-week-old mice were determined by DCFH-DA staining followed by FACS analysis (middle panels). Relative fluorescent intensity of RBC from SOD1+/+ and SOD1−/− mice using DCFH-DA (bottom panel). (C) After incubating erythrocytes with hypoxanthine/xanthine oxidase, the methaemoglobin content was measured. (D) Lipid peroxidation products were quantified as TBARS (n=4).

