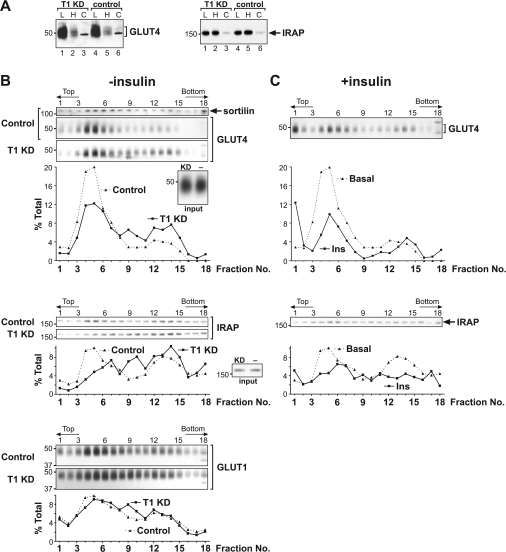
Figure 6. Effect of tankyrase knockdown on intracellular GLUT4 and IRAP distribution.
(A) PNSs of adipocytes electroporated on day 6 with T1A (lanes 1–3) or the point-mutation control pmt (lanes 4–6) and serum-starved on day 8 were subjected to differential centrifugation. From each 10 cm plate of adipocytes, 1% of the LDM (lanes 1 and 4), 5% of the HDM (lanes 2 and 5) and 1.5% of the cytosolic fraction (lanes 3 and 6) were loaded on to SDS gels for immunoblotting. The blots shown are representative of five independent experiments. (B) Day 6 adipocytes were electroporated with T1A (solid curves) or the control pmt (dotted curves) and harvested on day 8 after a 2 h serum starvation. PNS of controls and knockdowns were resolved in parallel in 14% self-forming iodixanol density gradients, and fractions were immunoblotted for the indicated proteins. The effect of the knockdown shown is representative of four batches of electroporated cells. The insets compare knockdowns (left-hand lane) with controls (right-hand lane) (20 μg of protein/lane) for the amount of GLUT4 and IRAP in the input PNS. (C) Adipocytes electroporated with the control siRNA pmt as in (B) were stimulated with 20 nM insulin for 20 min. PNS were fractionated in 14% iodixanol gradients, immunoblotted for GLUT4 and IRAP in parallel with (B), and plotted as solid curves. The dotted curves representing basal controls were taken from (B). The insulin effect shown is representative of two independent experiments. T1 KD, tankyrase 1 knockdown.

