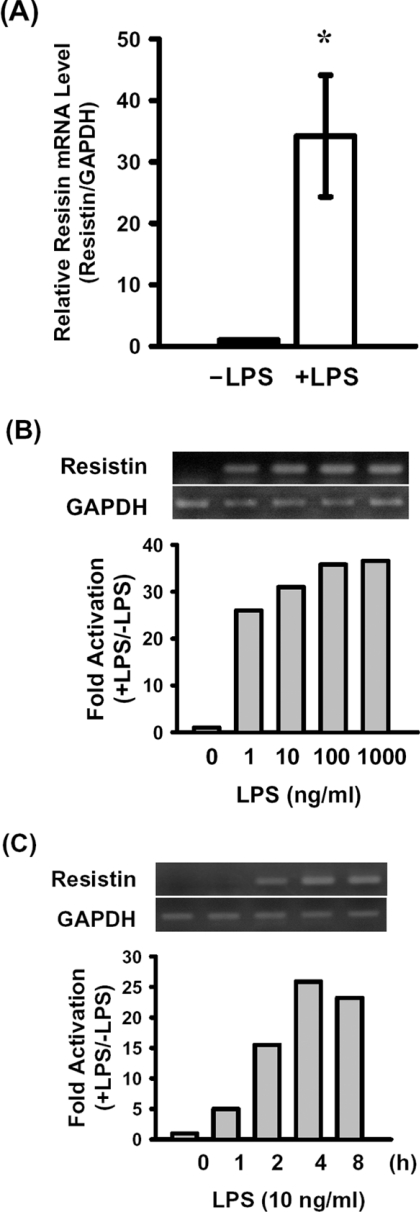
Figure 1. Resistin mRNA levels in RAW264.7 macrophages with or without LPS treatment.
(A) Total RNA was isolated from untreated RAW264.7 cells or cells treated with 100 ng/ml LPS for 8 h. Resistin and GAPDH mRNA were detected by real-time PCR as described in the Experimental section. Levels of resistin mRNA were normalized to those for GAPDH and the results were expressed relative to those in the untreated control (−LPS; relative value=1). Results are means±S.D.; n=3. *P<0.05 compared with the control. (B and C) RAW264.7 cells were treated with 0, 1, 10, 100 or 1000 ng/ml LPS for 4 h (B) or treated with 10 ng/ml LPS for 0, 1, 2, 4 or 8 h (C). Resistin and GAPDH mRNAs were amplified by RT–PCR and separated on a 1% agarose gel (upper panels). Resistin mRNA levels were normalized to those for GAPDH and expressed relative to those in the untreated cells (relative value=1) (lower panels). Similar results were obtained in three independent experiments.

