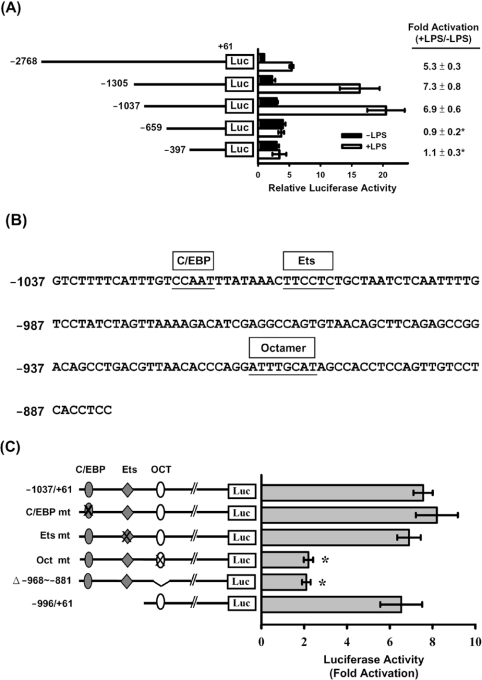
Figure 2. Analysis of mouse resistin gene promoter activity in RAW264.7 cells.
Various 5′-deletion or mutant pResistin-Luc constructs were co-transfected with phRL-TK (internal control) into RAW264.7 cells using the SuperFect reagent. At 20 h after transfection, the cells were left untreated (■, −LPS) or were treated with 10 ng/ml LPS (□, +LPS) for 4 h, then luciferase activities were assayed as described in the Experimental section. (A) Schematic representation of the 5′-deletion promoter–luciferase constructs. The Photinus luciferase activity was normalized to the Renilla luciferase activity, and is shown on the x-axis as the relative activity compared with that for pResistin(−2768/+61)-Luc in cells with no LPS treatment (relative value=1). The fold activation (+LPS/−LPS) of luciferase activity is the ratio of the activity after LPS treatment to that in the absence of LPS and is shown on the right. Results are means±S.D. for at least three independent experiments. *P<0.05 compared with pResistin(−2768/+61)-Luc, pResistin(−1305/+61)-Luc or pResistin(−1037/+61)-Luc. (B) DNA sequence of the resistin promoter from nucleotide −1037 to −881. The C/EBP, Ets and Octamer elements are indicated by boxes above the sequence. (C) The different mutants (mt) are shown in the left-hand panel, the mutated elements being indicated by a cross. Fold activation (+LPS/−LPS) of luciferase activity by LPS treatment is shown in the right-hand panel. Results are means±S.D. for at least three independent experiments. *P<0.05 compared with the wild-type control.

