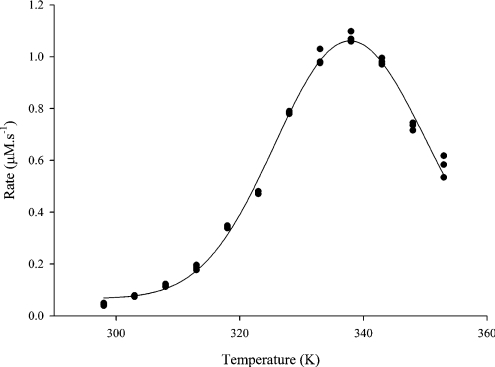
Figure 2. The effect of temperature on the initial (zero-time) rate of reaction of acid phosphatase.
Acid phosphatase was assayed continuously as described by Peterson et al. [2]. For each triplicate progress curve, the initial rate of reaction was determined using the linear search function in the programme, Vision32™. The data are plotted as rate (μM·s−1) against temperature (K).

