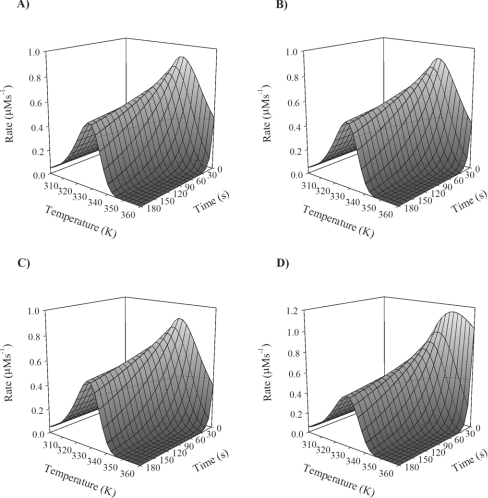
Figure 3. Data sampling requirements: the effect of data points beyond Topt.
Acid phosphatase was assayed as described by Peterson et al. [2]. Temperature points above the Topt (see Figure 2) were sequentially truncated from the complete data set to determine the influence of data points above the Topt on the final parameter values. Illustrated here are the results plotted as rate (μM·s−1) against temperature (K) against time (s) for the fit of acid phosphatase data to the Equilibrium Model using (A) the full data set, (B) the data set excluding the last data point, (C) the data set excluding the last two data points, and (D) the data set excluding the last three data points.

