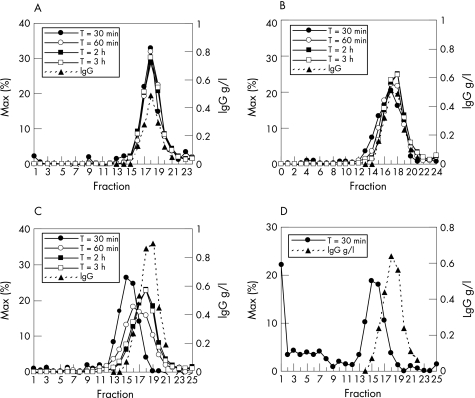
Figure 3 Sucrose gradients of sera of responders A and B (A,B) and of non‐responders C and D (C,D). The measured radioactivity in the fractions as a percentage of the maximum radioactivity at each time point (% of maximum) is shown. The values on the y axis in D have been adjusted to the lower amounts of radioactivity in the 30‐min sample to visualise the size of the antibody complexes in this patient.

An official website of the United States government
Here's how you know
Official websites use .gov
A
.gov website belongs to an official
government organization in the United States.
Secure .gov websites use HTTPS
A lock (
) or https:// means you've safely
connected to the .gov website. Share sensitive
information only on official, secure websites.
