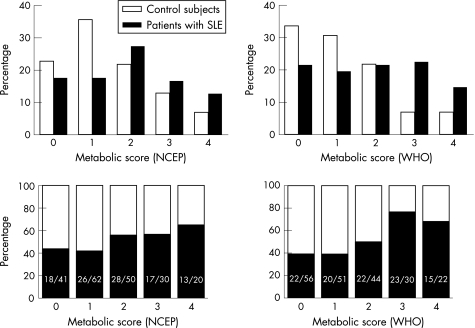
Figure 1 Prevalence of the metabolic syndrome scores among patients with systemic lupus erythematosus (SLE) and controls. The top two panels represent the proportion of patients with SLE (black) and controls (white) by the number of metabolic syndrome criteria met. The two panels at the bottom represent the proportion of patients with SLE (black) and controls (white) in each individual metabolic syndrome score. p Values using the χ2 test for trend were 0.04 and 0.001 using the National Cholesterol Education Program Adult Treatment Panel III (NCEP) and the World Health Organization (WHO) definitions, respectively.

An official website of the United States government
Here's how you know
Official websites use .gov
A
.gov website belongs to an official
government organization in the United States.
Secure .gov websites use HTTPS
A lock (
) or https:// means you've safely
connected to the .gov website. Share sensitive
information only on official, secure websites.
