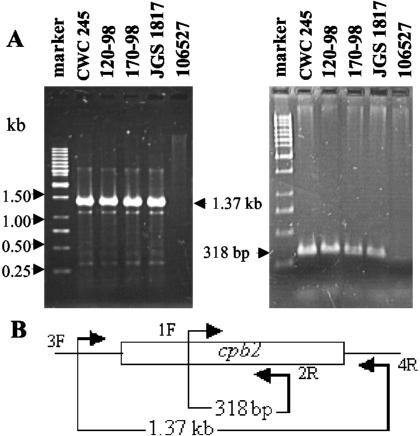
FIG. 1.
PCR analysis of pig GI disease isolates. (A) Representative results of a PCR assay with primers designed to amplify 1,373- and 318-bp PCR products. The migration of the PCR products derived from each primer set is indicated between the two gels. Results are shown for control strains CWC245 (a known cpb2-positive C. perfringens type C strain) and 106527 (a cpb2-negative type C strain) and representative pig GI disease isolates 120-98, 170-98, and JGS1817. DNA size markers (GeneRuler 1-kb ladder; Fermentas) are shown in the left lane of each gel. (B) Schematic diagram showing the location of each primer in CWC245 DNA (10).

