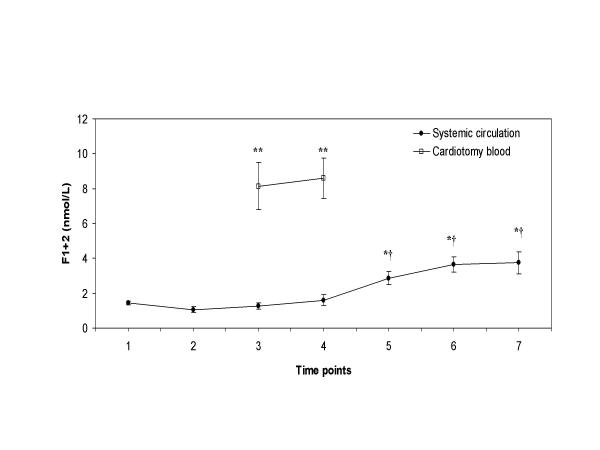
Figure 2.
Plasma levels of prothrombin fragment 1+2 Plasma levels of F1+2 with time in patients undergoing CPB (●), and in the cardiotomy blood (□). Blood samples were taken at the various time points as described in the "Methods" section. Data are presented as mean ± SEM. Asterisks indicate a statistically significant difference compared with the sample before heparin administration (P < 0.05 by paired Student's t test); double asterisk indicate a statistically significant difference between the simultaneous samples of the cardiotomy blood and the systemic circulation (P < 0.001 by paired Student's t test); cross signs indicate a statistically significant difference compared with the sample before retransfusion of the cardiotomy blood (P < 0.05 by paired Student's t test).

