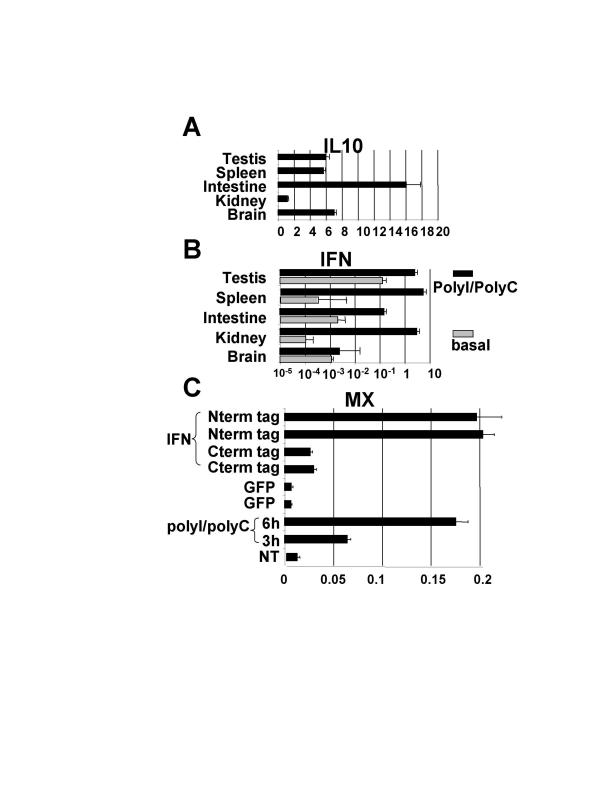
Figure 6.
Expression pattern of the TnIFN and TnIL10 genes and accumulation of the TnMX mRNA after IFN treatment. Results are amounts of mRNA relative to the hnRNPA2 mRNA. 5% confidence in a student T test is shown. A) TnIL10 in different tissues. B) TnIFN in different tissues in animals injected by PolyI/PolyC or PBS(basal). C) TnMX in primary kidney cells treated either with PolyI/PolyC, recombinant GFP (Green Fluorescent Protein) or recombinant TnIFN with either Nterm or Cterm 6His tag.

