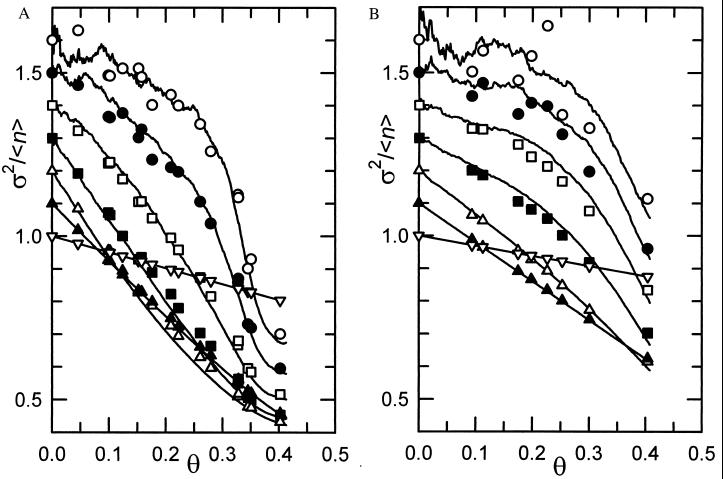
Figure 2.
(A) Reduced variance σ2/〈n〉 as a function of the coverage θ for the P07 system. The symbols correspond to the experimental values, and the lines correspond to the simulations. The results corresponding to the different subsurface areas considered have been successively shifted by 0.1 for the sake of clarity. The symbols appearing on the y axis are ranked in order of decreasing size of the subsurfaces from top (ℓ = 0) to bottom (ℓ = 6). (B) Same as A, except that σ2/〈n〉 corresponds to the P21 system.

