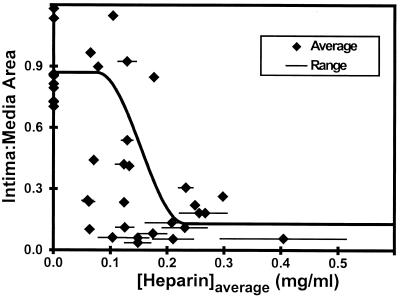
Figure 5.
Intima-to-media area ratios versus the time- and space-averaged concentrations (♦). The range of space averaged concentrations in the intima and media over the 2-week experiment is shown by the lines. The time- and space-averaged concentrations were estimated as the average between these two limits. An estimated sigmoidal fit illustrates the dose response.

