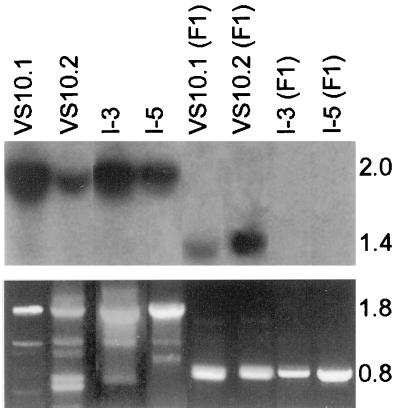
Figure 2.
Excision of bar gene in F1 progenies. (Upper) EcoRI-cleaved DNA of VS10.1, VS10.2, I-3, I-5, and their representative F1 outcross (to Cre37 or Cre37S) progenies were hybridized to bar (probe a, Fig. 1). (Lower) PCR using primers corresponding to P1 and P2 sequences. Parental DNA shows a 1.8-kb band resulting from the presence of bar between P1 and P2. Representative F1 progenies show a 0.8-kb band from the formation of a new P1-loxP-P2 junction.

