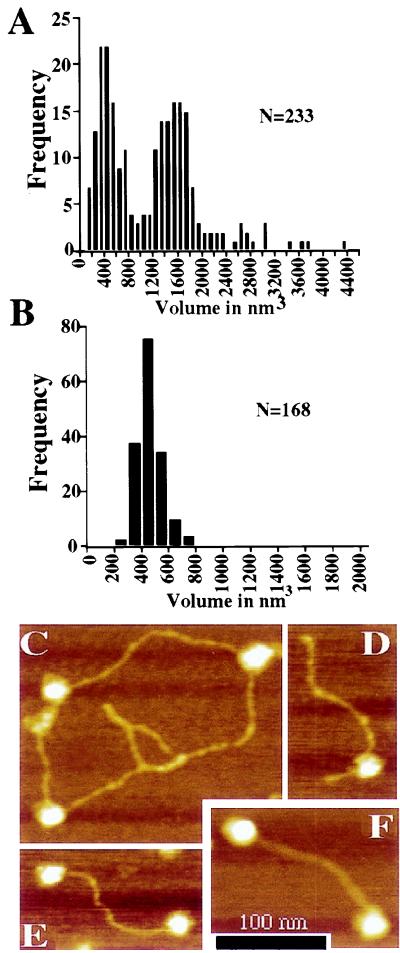
Figure 3.
Analysis of ATM by atomic force microscopy. (A) The volume of ATM particles adsorbed to freshly cleaved micas was calculated from atomic force micrographs. Two distinct populations were observed in the sample at 200 mM KCl. Peaks in the volume distribution are apparent at ≈400 and ≈1,600 nm3. (B) The volume of free DNA-PKcs was measured as a control for volumetric analysis of the ATM particle. DNA-PKcs displays a single peak in the volume distribution with an average particle volume of 479 nm3. (C–F) Height-encoded atomic force micrographs of ATM in association with DNA. (C) ATM particles bound to supercoiled pBluescript plasmid. (D) A 660-bp linear DNA with blunt ends is bound by an ATM particle at an internal site. (E and F) The majority of linear DNAs bound by ATM are associated with the protein through an interaction involving a DNA end. (Bar = 100 nm.)

