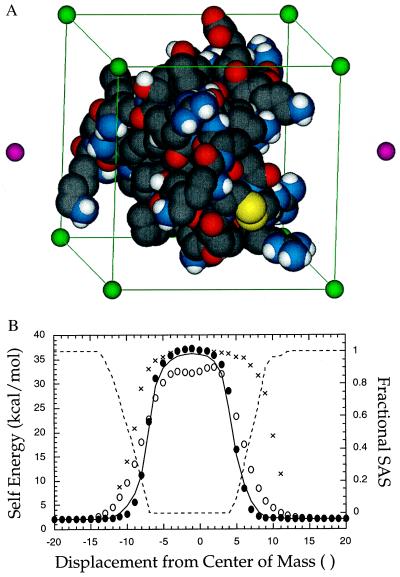
Figure 2.
The MTK potential in BPTI. (A) To test the MTK electrostatic potential, a grid of 1-Å unit test charges was superimposed onto the protein BPTI. The edges of the grid (green spheres and lines) are aligned along BPTI’s principal axes of inertia. The grid originates at the center of mass of BPTI. Two points located on the axis of inertia with the largest moment also are shown (magenta spheres). (B) The self energy of a 1-Å unit test charge is plotted at positions along a principal axis of inertia of BPTI. The DelPhi self energy is indicated by a solid line. Self energies calculated by MTK (solid circles), the Gaussian-atom Coulomb field integral of ace (18) (open circles), and mimel (21) (cross hatch) are also shown. The fractional solvent-accessible surface area (SAS) of the test charge (dashed line) is plotted against the vertical axis on the right.

