
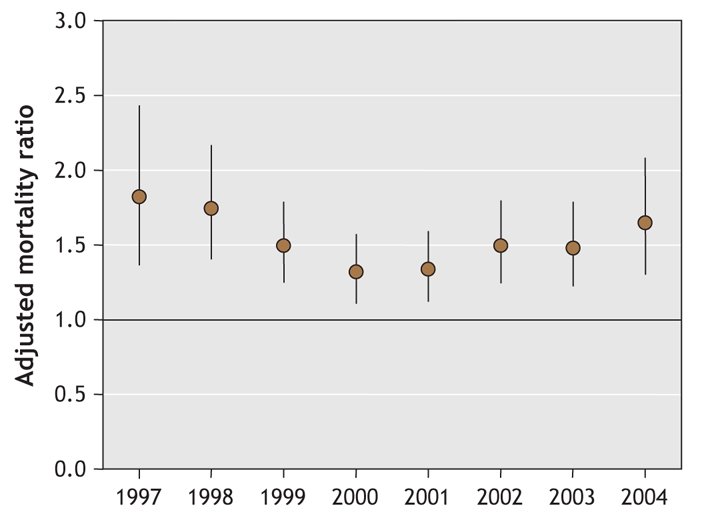
Fig. 2: Yearly adjusted mortality ratios comparing the risk of death between the conventional and atypical antipsychotic drug groups, from 1997 to 2004. Error bars represent 95% confidence intervals.
Official websites use .gov
A
.gov website belongs to an official
government organization in the United States.
Secure .gov websites use HTTPS
A lock (
) or https:// means you've safely
connected to the .gov website. Share sensitive
information only on official, secure websites.
Fig. 2: Yearly adjusted mortality ratios comparing the risk of death between the conventional and atypical antipsychotic drug groups, from 1997 to 2004. Error bars represent 95% confidence intervals.