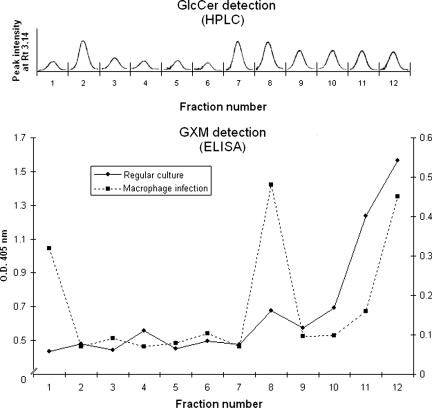
FIG. 7.
Analysis of vesicle fractions obtained after ultracentrifugation and sucrose gradient separation. Fractions from supernatants of regular cultures were extracted with chloroform-methanol mixtures and analyzed by HPLC. In each fraction, a single peak with a retention time (Rt) corresponding to a GlcCer standard was detected. Analysis of the same fractions (solid line) or preparations obtained from infected macrophages (dashed line) by capture ELISA revealed different profiles of GXM distribution, although the polysaccharide was always expressively detected in the region of the gradient presenting the highest density. Lipid and polysaccharide analyses were performed at least three times, always presenting similar profiles. O.D. 405 nm, optical density at 405 nm.

