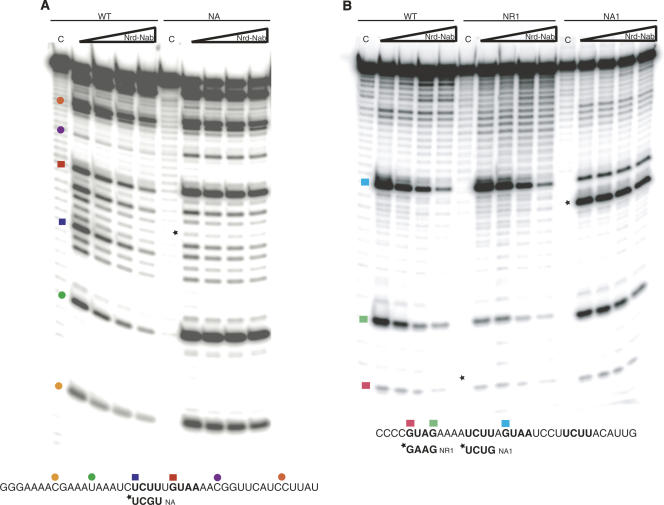
FIGURE 5.
Footprint of Nrd1–Nab3 on RNA. (A) RNase A footprinting of U6R* RNA oligos and Nrd1–Nab3. RNase A cuts after cytosine and uridine residues in single-stranded RNA. The WT U6R* sequence is indicated at the bottom with the NA mutant RNA sequence change underneath. (B) RNase T1 footprinting of snR13 RNA oligos and Nrd1–Nab3. RNase T1 cuts after guanosine residues in single-stranded RNA. The WT snR13 sequence is indicated at the bottom with the NR1 and NA1 mutant RNA sequence changes underneath. The “C” indicates a control lane containing no RNase. Wedge represents increasing concentration of Nrd1–Nab3 heterodimer: 0, 0.625, 1.25, and 2.5 μM. Mutations are indicated by an asterisk. Colored squares represent bases in an Nrd1 or a Nab3 motif and colored circles represent additional bases along the RNA. Locations on the RNA oligo and corresponding position on the gel are denoted by the squares and circles.

