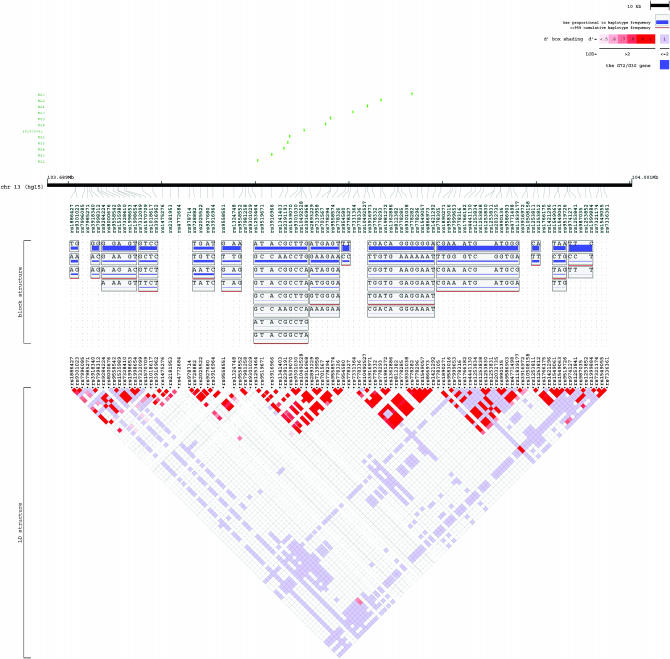
Figure 3.—
Representation of the LD structure. The LD structure for the G72/G30 genes, spanning 282 kb, was constructed using genotype data from 108 SNPs. The 12 polymorphisms are shown in green. Vertical tick marks above the name indicate the relative genomic position of each SNP. The LD structure represents the pairwise calculation of D′ for each possible combination of SNPs. D′ < 0.5 is shown in white, D′ = 1.0 in dark red, with increasing shades of red representing increasing D′ among the SNPs. It was produced by Locusview software (T. Petryshen, A. Kirby and M. Ainscow, unpublished results).

