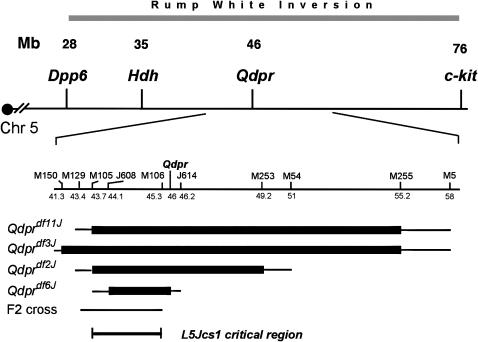
Figure 2.—
Map of the L5Jcs1 region. (Top) Map of the Rw inversion region of mouse chromosome 5. Some gene loci are indicated. (Bottom) The region surrounding the Qdpr deletion complex is expanded. The extents of deletions are indicated as thick horizontal bars. The thinner bars at the ends of the thicker bars indicate the intervals in which the breakpoints lie. The region to which L5Jcs1 was mapped in the F2 cross is indicated. Microsatellite loci are abbreviated with the prefix “M” instead of D5Mit. Numbers under these markers are megabase coordinates according to the February 2006 mouse genome assembly Build 36. The L5Jcs1 critical region is indicated.

