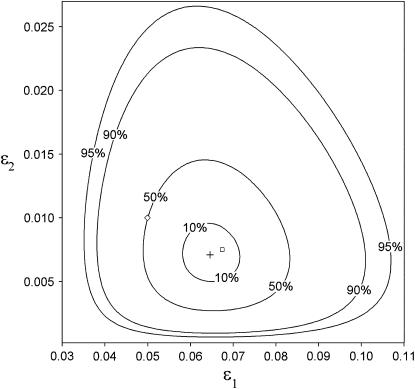
Figure 1.—
Maximum-likelihood (ML) estimates (+) and confidence regions for the population allelic dropout and false allele rates, ɛ1 and ɛ2 (⋄). ML error rates were estimated from 100 simulated duplicate genotypes where He = 0.85, ɛ1 = 0.05, and ɛ2 = 0.01. The seven duplicate genotype category counts were (10, 67, 17, 2, 2, 0, 0) with two double dropouts uncounted. The sample error rates,  and
and  , are also shown (□). Confidence regions were calculated by descending
  log-likelihood units from the ML estimate, where α = 1 − confidence (Wilks interval).

