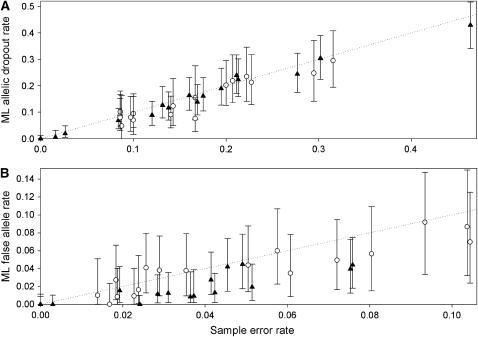
Figure 5.—
Performance of the ML method in estimating allelic dropout rate per heterozygote (A) and false allele rate per genotype (B) from real data. Two duplicated microsatellite data sets were analyzed: 149–182 red fox teeth genotyped at 16 loci (▴) and 72–121 Ethiopian wolf fecal samples genotyped at 17 loci (○). The dotted line shows equality between ML and sample error rates. The sample error rates in the duplicate genotypes were counted by referring to the consensus genotypes. Error bars show 95% confidence intervals for the ML estimates, calculated as described in Table 2.

