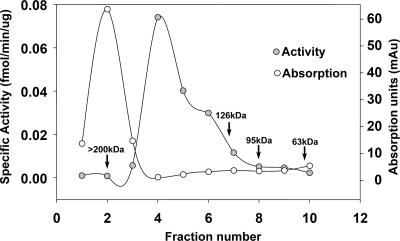
FIG. 7.
FPLC analysis of GST-AID. GST-AID was fractionated using a 200-kDa size exclusion column on an automated FPLC machine. Fractions were eluted, and each fraction was tested in the deamination assay. The curve with open circles shows the UV absorption value for each fraction as it was eluted from the column, thus representing the amount of GST-AID in each fraction. The curve with filled circles represents the results of the deamination assay on each fraction. Briefly, fractions were concentrated and incubated with 20 fmol of HS1bub7 substrate and UDG in an activity buffer. The amount of cleaved product was quantitated and divided by the reaction incubation time and the amount of input GST-AID (calculated from the UV absorption values) to obtain the specific activity of each fraction. Arrows indicate elution points of molecular mass standards on the same column, allowing for the estimation of the molecular mass of each GST-AID species in each fraction.

