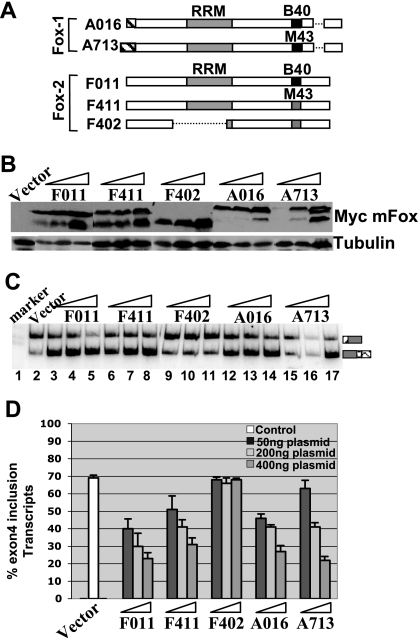
FIG. 2.
Overexpression of Fox-1 and Fox-2 represses the calcitonin-specific exon 4 inclusion. (A) Schematic diagram of Fox-1 and Fox-2 isoforms used in the present study. The broken lines indicate that the sequence is not included in a specific isoform. This diagram is recreated based on the findings of Nakahata and Kawamoto (30). (B) Western blot analysis showing overexpression of different Myc-tagged Fox-1 and Fox-2 isoforms in HeLa cells. The blot was probed with antitubulin (control) and anti-Myc antibodies. For each isoform, increasing amounts (50, 200, or 400 ng) of the expression plasmid was used in the transfections. (C) RT-PCR assay as in Fig. 1D. (D) Quantification the RT-PCR results shown in panel C.

