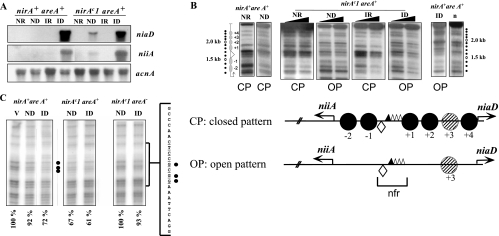
FIG. 4.
nirAc1 phenotype. (A) Northern blots of niiA and niaD mRNAs in the nirA+ areA+ and the nirAc1 areA+ strains grown under ND (urea as the sole nitrogen source), ID (nitrate as the sole nitrogen source), IR (nitrate plus ammonium as the nitrogen sources), or NR (ammonium as the sole nitrogen source) conditions. The acnA (actin) hybridization serves as loading control. (B) Nucleosome positioning in the bidirectional niiA-niaD promoter region comparing nirA+ and nirAc1 strains in an areA+ background. Samples from the same mycelia as in panel A were incubated with increasing amounts of MNase (black triangles). The top panel shows an MNase digestion pattern of a nirAc1 mutant under all of the conditions described in panel A. Patterns of MNase digestion for the wild-type strain (nirA+, areA+) grown under the same conditions have been published previously; here we show two extreme (NR and ID) conditions as controls. A naked DNA control, also published previously, is also shown (lane n). The position of the DNA fragments is shown by dots to the side of the autoradiogram. A 100-bp DNA ladder run in these gels, used to calculate the position of the MNase cuts, is not shown for the sake of clarity. The positions of the nucleosomes are shown to the left of the autoradiograms and are numbered divergently from the nucleosome-free region (nfr) as referred to in reference 33. The DNA bands correspond exactly to those described in previous publications (33-35). These experiments were repeated several times with identical results. The bottom panel shows the two patterns of nucleosome organization of the niiA-niaD intergenic region, a closed pattern (CP) that is seen in the wild-type strain (nirA+ areA+) under NR, ND, and IR conditions and an open pattern (OP) that is seen only under ID conditions (33, 34). For the nirAc1 mutant the OP is seen also under ND conditions. The corresponding patterns are also indicated under all MNase digestion tracks in the upper panel. Positioned nucleosomes (CP) are depicted as closed circles and numbered divergently from the nucleosome-free region (nfr). In the open pattern there are no positioned nucleosomes in the intergenic region. The putative positioning of nucleosome +3 cannot be determined by MNase digestion and hence is depicted as a hatched circle. Transcription factor binding sites discussed in this study are shown as a lozenge (NirA binding site 2) and triangles (AreA binding sites 5 to 8). AreA binding site 5, which was shown to be occupied by the protein under all nitrogen conditions, is represented as a filled triangle. Transcription start points are indicated by arrows. (C) In vivo methylation protection of NirA site 2 in the wild-type strain (nirA+ areA+) and in nirAc1 strains with functional (nirAc1 areA+) and nonfunctional (nirAc1 areA−) AreA. Strains were grown under the conditions described above. V, in vitro-methylated control DNA. Filled circles indicate protected guanines within the NirA binding sequence that is shown to the side of the autoradiographs (site 2, underlined). The results of quantitative phosphorimager analysis are presented as the percent intensity of the relevant guanines within NirA binding site 2 compared to nonprotected guanines in the same lane. The relationship of the intensities between the three relevant guanines within the NirA binding sequence and the three nonprotected guanines in the in vitro-methylated DNA (V) was set to 100%. All panels are from the same experiment and were run in parallel in the same gel but are shown separately for the sake of clarity. Values under the panels indicate percentage of protection of the three relevant guanines.

