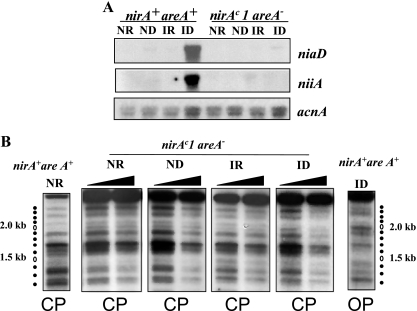
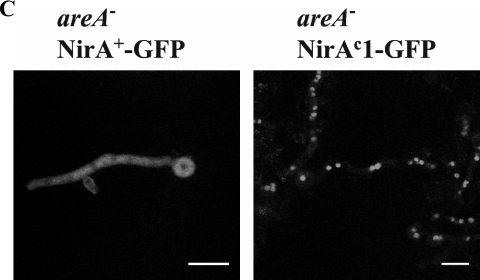
FIG. 5.
Dependence of the nirAc1 phenotype on areA function. (A) Northern blots of niiA and niaD mRNAs in the nirA+ areA+ and nirAc1 areA600 strains grown under ND (urea as the sole nitrogen source), ID (nitrate as the sole nitrogen source), IR (nitrate plus ammonium as the nitrogen sources), or NR (ammonium as the sole nitrogen source) conditions. The acnA (actin) hybridization serves as a loading control. (B) Nucleosome positioning in the bidirectional niiA-niaD promoter region comparing nirA+ areA+ and nirAc1 areA600 strains. Samples from the mycelia shown in panel A were subjected to increasing amounts of MNase (black triangles). To the sides of the autoradiographs, the position of DNA fragments calculated from a 100-bp ladder is shown. Independently obtained control patterns from the wild-type nirA+ areA+ strain under NR and ID conditions are shown for comparison. Molecular mass markers were run in the same gel. The naked DNA control is shown in Fig. 1B. CP, closed pattern; OP, open pattern (see Fig. 1B and the legend to this figure). (C) Subcellular localization of NirA as a GFP fusion protein in an areA mutant background. areA mutant strains ERE-nirA+-GFP (left) and ERE-nirAc1-GFP (right) were grown as described in Materials and Methods for ∼14 h under ND conditions with arginine as the sole nitrogen source (identical nuclear localization patterns were obtained with other ND nitrogen sources such as urea, proline, or hypoxanthine). Induction of the GFP fusion proteins was obtained by the addition of 100 pM DES 5 h prior to the microscopic observations. GFP localization was examined by confocal laser scanning microscopy, and the positions of the nuclei were determined by DAPI (4′,6′-diamidino-2-phenylindole) staining (not shown). Scale bar, 10 μm. Urea, used as a standard ND nitrogen source, resulted in unexpected high vacuolization of mycelia in areA strains and, consequently, observations on arginine rather than on urea are shown in this figure.


