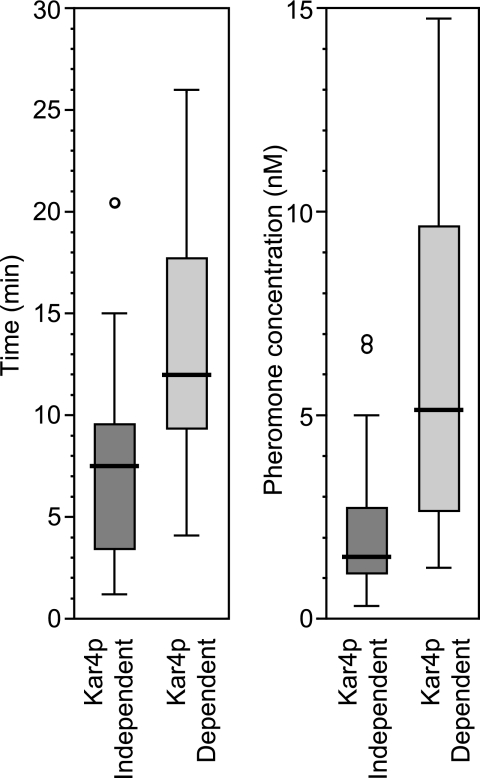
FIG. 6.
Temporal and pheromone concentration regulation of Kar4-dependent genes. (A) Genes showing greater than 2.5-fold induction by pheromone from cluster 1 (Kar4-independent [34]) and cluster 2 (Kar4 dependent [29]) were selected, and datum points were taken representing the log2 (ratio) of normalized expression at 0, 15, 30, 45, and 60 min after induction by pheromone (39). A pheromone response curve was generated for each gene, and the t1/2 was extracted from the interpolated data. Primary data were from Roberts et al. (39). (B) Box plot representing the concentration of pheromone corresponding to the half-maximal induction of each of the Kar4-dependent and Kar4-independent pheromone response genes. The data determined from the log2 (ratio) of normalized expression at 30 min after exposure of a bar1Δ strain to various concentrations of pheromone (0.15, 0.5, 1.5, 5, 15.8, 50, and 158 nM α-factor) Primary data were from Roberts et al. (39).

