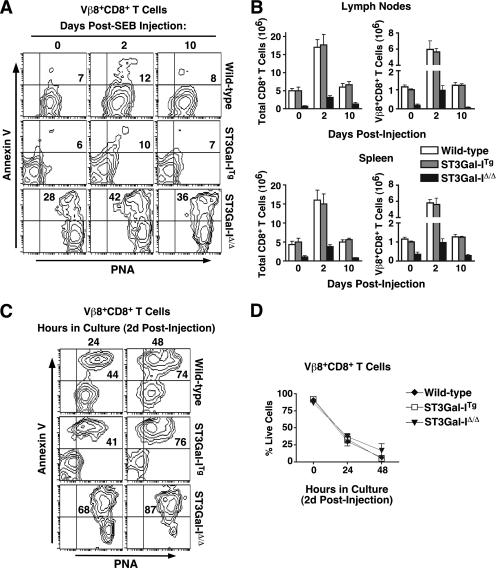
FIG. 5.
Relationship of core 1 O-glycan structure to CD8+ T-cell apoptosis following a bacterial antigen-driven immune response in vivo. (A) PNA ligands and annexin V reactivity were assessed by flow cytometry among live (7-AAD−) Vβ8+ CD8+ T cells isolated from wild-type, ST3Gal-ITg, and ST3Gal-IΔ/Δ mice 0, 2, and 10 days post-SEB injection. (B) Total numbers of CD8+ and Vβ8+ CD8+ T cells from the lymph nodes and spleen of wild-type, ST3Gal-ITg, and ST3Gal-IΔ/Δ mice at 0, 2, and 10 days postinjection with SEB. Cells were enumerated by hemacytometer counts in combination with percentages obtained by flow cytometric analysis. (C) PNA ligands and annexin V reactivity were assessed by flow cytometry among live (7-AAD−) Vβ8+ CD8+ T cells removed from wild-type, ST3Gal-ITg, and ST3Gal-IΔ/Δ mice 2 days post-SEB injection and analyzed after 24 or 48 h in culture. Numbers in panels A and C indicate percentages of cells in the upper right quadrant and are representative of results from three separate experiments. (D) Percentage of live (7-AAD−) Vβ8+ CD8+ T cells during the 48 h in culture following isolation at 2 days post-SEB injection. Data in panels B and D are presented as means ± standard errors of the means (n = 3).

