FIG. 7.
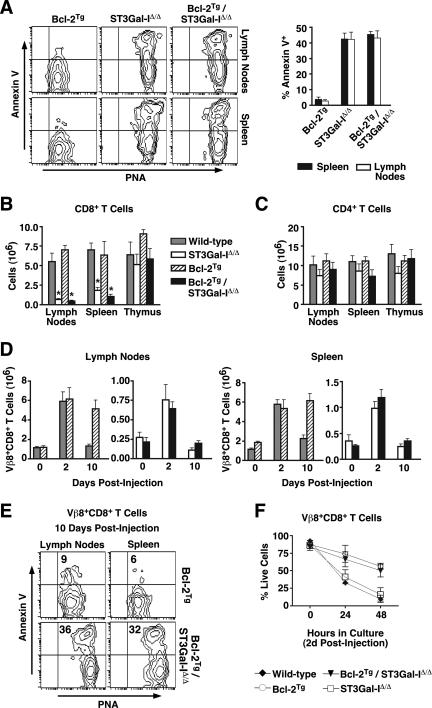
Loss of ST3Gal-I overcomes Bcl-2 expression to induce CD8+ T-cell apoptosis in vivo, but not in vitro, coincident with the expression of unsialylated core 1 O-glycans. (A) Flow cytometric analysis of live (7-AAD−) CD8+ cells from the lymph nodes and spleens of wild-type, Bcl-2Tg, ST3Gal-IΔ/Δ, and Bcl-2Tg/ST3Gal-IΔ/Δ mice. Percentages of annexin V+ cells are shown in the graph at the right depicting means ± standard errors of the means (n = 4). Total numbers of CD8 (B) and CD4 (C) SP cells from the lymphoid tissues of wild-type, Bcl-2Tg, ST3Gal-IΔ/Δ, and Bcl-2Tg/ST3Gal-IΔ/Δ mice. (D) Total numbers of Vβ8+ CD8+ T cells from lymph nodes and spleens of indicated mice at 0, 2, and 10 days postinjection with SEB. (E) PNA ligands and annexin V reactivity were assessed by flow cytometry among live (7-AAD−) Vβ8+ CD8+ T cells removed from Bcl-2Tg and Bcl-2Tg/ST3Gal-IΔ/Δ mice 10 days post-SEB injection. (F) Percentages of live (7-AAD−) Vβ8+ CD8+ T cells during the 48 h in culture following isolation at 2 days post-SEB injection. In all cases, cells were enumerated by hemacytometer counts in combination with percentages obtained by flow cytometric analysis. Data are presented as means ± standard errors of the means (n = 6 [A to C] and n = 3 [D, F]).  , statistically significant difference from wild-type littermates (P < 0.05, unpaired t test).

