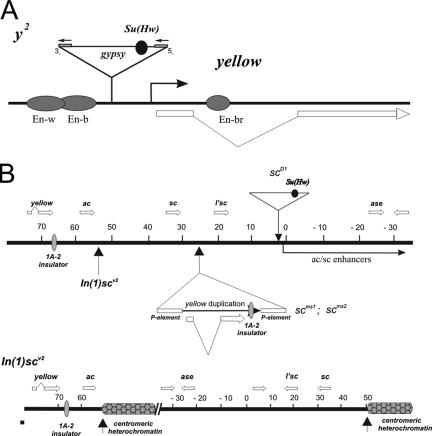
FIG. 3.
(A) Structure of the yellow locus in wild-type and y2 alleles. Exons of the yellow gene are represented by white rectangles, and filled ovals represent various tissue-specific transcriptional enhancers that control yellow gene expression in the respective tissues. The gypsy insertion responsible for the y2 allele is represented by a triangle. Closed boxes flanking gypsy represent the long terminal repeats. The Su(Hw) insulator is represented by a closed circle located in the 5′ transcribed untranslated region of gypsy. (B) Schematic representation of the yellow/ac/sc region in the scD1, scms, and In(I)scV2 mutations (5, 21). The coordinates of the AS-C region are as defined in Campuzano et al. (5). Vertical arrows indicate the position of chromosomal breakpoints associated with the In(I)scv2 mutation. Arrows with a triangle show insertions of gypsy (scD1) and of P elements (scms) associated with duplication of the yellow sequences. Thick horizontal white arrows show the positions and direction of yellow and AS-C genes transcripts. The filled oval indicates the endogenous 1A-2 insulator and the Su(Hw) binding sites in gypsy.

