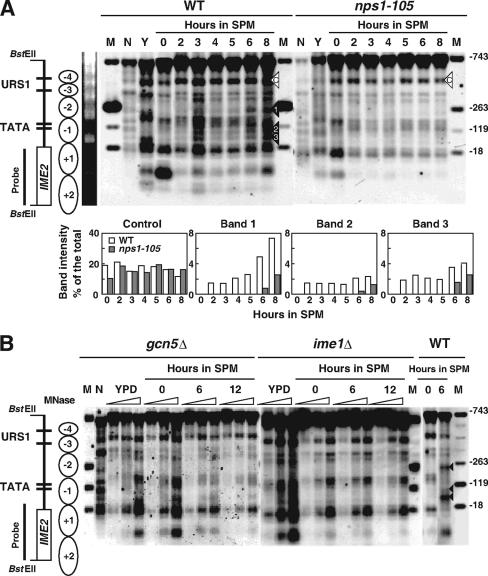
FIG. 1.
Analysis of chromatin structure of the IME2 gene. (A) Wild type (WT; W303-1D) or nps1-105 (WTH1-D) cells were harvested at the indicated times and processed for MNase digestion. Positions of nucleosomes with respect to the IME2 sequence are schematically indicated on the left side of the figure. MNase cleavage sites enhanced or not enhanced (control) in the wild type are marked with closed or open triangles, respectively. Southern blots were scanned by a Bioimaging analyzer, and the percentage of the newly appeared bands in SPM, relative to all bands produced in the same lane was calculated (bar graphs below the panel). N, the naked DNA control; Y, the sample from cells vegetatively growing in YPD medium. From the top, the sizes of the marker bands are 992, 512, 368, and 267 bp. The nucleotide positions of the IME2 ORF corresponding to each marker band are indicated on the right side. This experiment was performed three times with good consistency. Typical results are presented. (B) MNase mapping was carried out on gcn5Δ (WTI20-D) or ime1Δ (WMY10-D) cells as described for panel A.

